MRI and neurophysiological measures

Selected By
Lori Mayer, DNP, MSN, RN, MSCN
Why is this important to me?
MS is a complex disease, and the effectiveness of disease-modifying therapies varies from person to person. Let's think about the reasons for these differences in the way people respond to therapy: first, we know that MS differs in the intensity and kinds of symptoms that people experience. Second, each individual with MS responds differently to a specific therapy. Available disease-modifying therapies have several and often different ways of working, so it should not surprise anyone that one therapy may not work for an individual, and another may deliver good results.
In MS, damage to the brain and spinal cord occurs during the disease process. Thus, early and accurate monitoring of this damage is needed to assess disease progression and how well an individual is responding to treatment, and to predict future disability. So, MRI and other tests can help healthcare providers assess how well an individual is responding to their disease-monitoring therapy.
What is the objective of this study?
The authors discussed two different methods of monitoring damage to the brain and spinal cord in MRI and neurophysiological monitoring.
Magnetic resonance imaging (MRI)
- MRI allows your medical team to see changes in the structure of your brain and spinal cord. The authors looked at how well MRI was able to predict the likelihood that an individual who had experienced a clinically isolated syndrome (CIS) would convert to MS and how quickly they would likely convert.
- MRI can show:
- Lesions
- Brain shrinkage, or atrophy
- Inflammation
- The presence of a type of lesion called “T2 hyperintense” lesions on MRI in people with clinically isolated syndrome (CIS) can help to predict conversion to MS and future disability.
- Lesions in the spinal cord or gray matter (regions of the brain that contain primarily nerve cells) on MRI also appear to be useful in predicting conversion to MS in people with CIS.
- Brain atrophy occurring shortly after a CIS seems to predict early conversion to MS.
Neurophysiological monitoring
- Neurophysiological monitoring allows the healthcare team to monitor changes in the function of your brain and spinal cord. This type of monitoring can help healthcare providers to understand how the brain and spinal cord respond to stimulation. These are generally called "evoked potentials.”
- The most common types of evoked potentials are:
- Visual, which measure the brain's response to light and color.
- Somatosensory, which measure the brain and spinal cord response to pressure, pain, and warmth.
- Motor, which monitors the response of peripheral muscles to stimulation of the brain's motor cortex.
- Combined use of several neurophysiological monitoring techniques can help to assess the extent of disability and may provide insight into the likelihood of early, intermediate, and long-term future disability.
- Monitoring of motor systems can predict recovery after a relapse.
- Some types of vision monitoring can predict disability and damage to the spinal cord, but we do not yet know whether vision monitoring can help to predict an individual's response to disease-monitoring therapy.
As our ability to view and monitor changes in the structure and function of the brain and spinal cord improves with technology, we believe that this understanding will allow personalized selection of treatments that are best suited for you, and may ultimately lead to a better outcome.
How did the authors study this issue?
The authors reviewed various studies describing the use of MRI and neurophysiological monitoring in people with CIS or MS.
| SHARE: | |||||
Original Article
MRI and neurophysiological measures to predict course, disability and treatment response in multiple sclerosis
Current Opinion in Neurology
Leocani, Letizia; Rocca, Maria A.; Comi, Giancarlo
ABSTRACT
Purpose of review The expanding portfolio for multiple sclerosis treatment, together with the consensus that neurodegenerative processes occur since the early disease phases, has increased the need for paraclinical tests with prognostic value on disease evolution and treatment response.
Recent findings
On the one hand, we face the development of MRI technology, from lesion detection, to global and regional volumetric measures, to tissue damage quantification within brain and spinal cord lesions and in normal appearing tissue, together with increased knowledge about their application. On the other hand, traditional neurophysiological techniques, such as evoked potentials, are being recently analyzed with a quantitative approach allowing us to reveal their correlation with actual and future disability, and are being complemented by more recent technical advancements, such as multifocal visual evoked potentials and optical coherence tomography, for the assessment of demyelination/remyelination and axonal loss, respectively.
Summary
The increased value of MRI and neurophysiological tools in predicting disease evolution and treatment response will impact the therapeutic management of multiple sclerosis, from the choice of the first treatment to the type and frequency of monitoring toward a tailored, time-adapting treatment approach.
INTRODUCTION
The choice of several first-line and second-line treatment options in multiple sclerosis has raised the i nterest in paraclinical measures for prognosis and monitoring of the disease course and treatment response. MRI provides important information on structural and functional nervous damage and has a unique value in revealing ongoing inflammation in the central nervous system. Neurophysiological techniques, particularly evoked potentials although much less sensitive to brain lesions compared with MRI, allow the functional assessment of central nervous conduction in eloquent pathways whose involvement plays an important role in determining disability. The possibility to provide information on the impact of demyelination on nervous conduction provides a rationale for their use as predictors of neurodegeneration prompted by demyelinating events, as well as markers of treatment response to agents improving nervous conduction, including remyelinating drugs. Following are recent advances in MRI and neurophysiological techniques in this respect. Individualized approach is the new horizon of multiple sclerosis therapy because of the complexity of the disease resulting in an interindividual variability and a large variability of the response to disease-modifying treatments (DMTs). The availability of techniques providing information on the level of tissue damage and on the future evolution of the disease (prognosis) is fundamental for the selection of the most appropriate treatment based on the specific risk/benefit profile. On the contrary, there are some initial evidences that also show the response to treatments could be quite variable, so the same techniques could also contribute to understand if a given patient has a good probability to respond to specific DMTs (predictivity). In this review, we will analyze aspects of both MRI and neurophysiological techniques.
MRI AND PROGNOSIS IN CLINICALLY ISOLATED SYNDROMES
MRI has an established role in the diagnostic workup of patients presenting with clinically isolated syndromes (CIS) suggestive of multiple sclerosis for an early demonstration of disease dissemination in space (DIS) and time and to rule out other neurological conditions that can mimic multiple sclerosis. This has led to the formal inclusion of MRI in the multiple sclerosis diagnostic criteria, which are updated routinely. Consensus guidelines for modifications of diagnostic MRI criteria have been recently proposed by the Magnetic Resonance Imaging in MS (MAGNIMS) network, based on latest imaging findings in these patients [1&&].
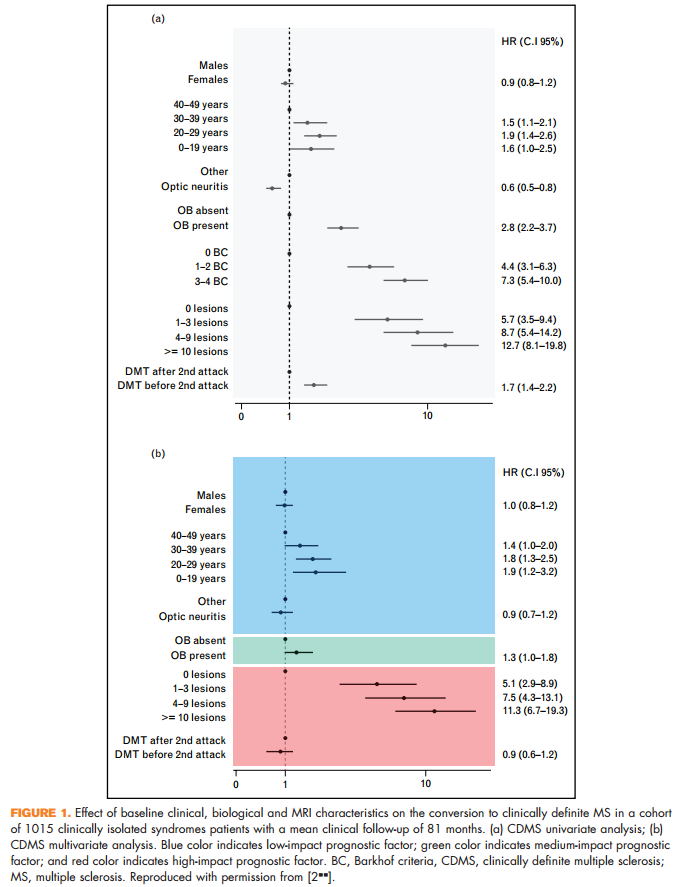
A study on a well-characterized cohort of 1015 patients with a mean clinical follow-up of 81 months confirmed that the number of brain T2 hyperintense lesions on the baseline MRI scans of these patients is the most robust predictor not only of conversion to multiple sclerosis over time, but also of accumulation of disability [2&&] (Fig. 1). Another 4.1-year follow-up study of 623 CIS cases further supported the importance of the number of baseline brain T2 focal lesions for multiple sclerosis development [3].
One aspect that has recently emerged, and which has been included in the MAGNIMS 2016 revision [1&&], is that the presence of three periventricular lesions is better than a single periventricular lesion to demonstrate DIS in CIS patients at risk of evolution to multiple sclerosis [4,5]. Having more than three periventricular lesions also contributes to distinguish multiple sclerosis patients from those with primary and secondary CNS vasculitis [6].
Other lesional MRI measures, which have been associated with an increased risk of evolution to multiple sclerosis over time, are the presence of spinal cord lesions (particularly in patients with CIS and nonspinal presentation, not fulfilling brain MRI for DIS) [7] and gray matter lesions [8]. Conversely a large multicenter study demonstrated that the presence of nonenhancing T1-hypointense lesions has no role for predicting a second clinical attack [9].
Substantial imaging improvements have occurred in terms of ameliorating differential diagnosis and improving specificity. Separated diagnostic criteria, including detailed imaging findings, have been proposed for neuromyelitis optica (NMO) spectrum disorders [10]. The utility of gray matter lesion detection and of the identification of the perivenular lesion location (obtained using T2 -weighted magnitude and phase imaging) for distinguishing multiple sclerosis from multiple sclerosis-mimicking conditions such as migraine [11], NMO [12] and ischemic white matter (WM) lesions [13] has been proven.
In a 53-month follow-up study of 176 CIS patients, atrophy of the whole brain and gray matter occurred within the first year after clinical onset. Short-term global brain volume loss after the CIS was associated with early disability development and early conversion to multiple sclerosis [14]. Development of gray matter atrophy and ventricular enlargement has been associated with disability progression over 4 years in another cohort [15].
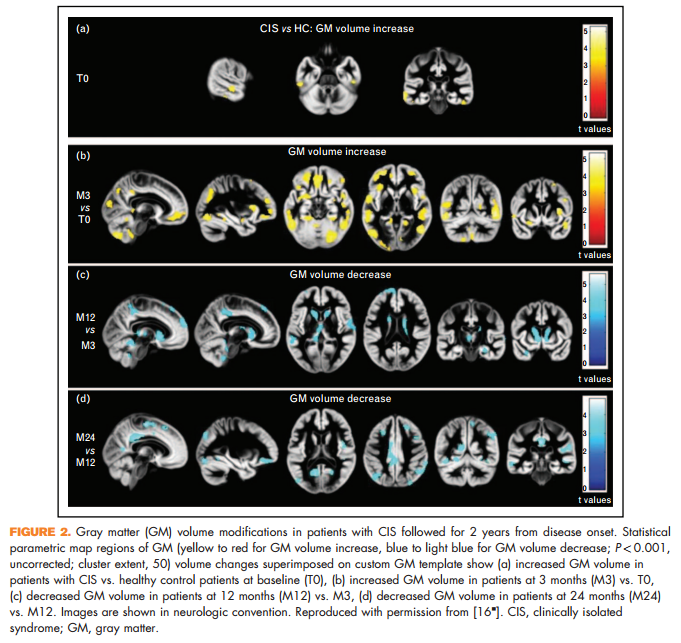
A 2-year study that combined atrophy and diffusion tensor MRI found dynamic modifications of regional gray matter and WM damage in CIS, with a progressive evolution of WM damage from disease onset and a transient, early increase in gray matter volume (which might reflect gray matter demyelination), followed by gray matter atrophy [16& ] (Fig. 2).
MRI AND PROGNOSIS IN MULTIPLE SCLEROSIS
In patients with established multiple sclerosis, improvements in the methods of acquisition and analysis have allowed obtaining novel pieces of information to distinguish the main disease clinical phenotypes and predict worsening of disability and cognitive dysfunction.
The prominent role played by gray matter damage in explaining disease clinical manifestations has been proven by plenty of studies, which have applied various MRI techniques, sensitive toward different pathological substrates of the disease, to measure gray matter involvement. An important step forward is the demonstration that some of these techniques preserve their validity when applied in a multicenter context, which clearly opens the windows for their use in the context of clinical trials and treatment monitoring [17,18]. Assessment of involvement of strategic gray matter structures contributes to explain the occurrence of specific symptoms and clinical progression. Hippocampal atrophy has been associated with deficits in memory encoding and retrieval [19]; lower g-aminobutyric acid concentration in the sensorimotor cortex correlated with worse motor function [20]; extension of cord lesions to gray matter has been associated with progressive multiple sclerosis and disability [21] and atrophy and microstructural abnormalities of the cord gray matter were more pronounced in secondary progressive multiple sclerosis patients and correlated with more severe disability [22,23&&].
In patients with relapse-onset multiple sclerosis, measures of gray matter damage taken on a baseline scan were the most important predictors of disability accumulation, evolution toward a more severe clinical phenotype and cognitive deterioration over the subsequent 13 years [24]. In a multicenter study of patients with long-established multiple sclerosis, long-term physical disability was independently correlated with cord atrophy and brain T2 lesions, and less consistently, with brain gray matter atrophy, suggesting that combinations of spinal cord and brain MRI measures may be required to capture clinically relevant information in multiple sclerosis patients of long disease duration [25].
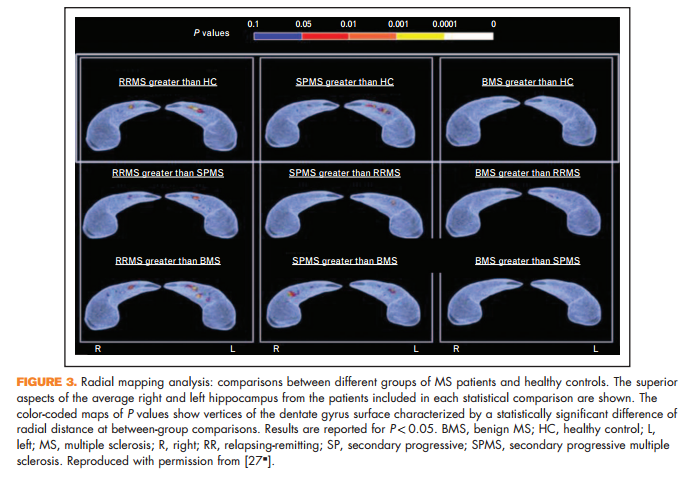
Novel in-vivo measures of important pathological processes have also been proposed. A reduced magnetization transfer ratio (MTR) of the outer surface of the cortex has been proposed as a measure of subpial demyelination. Such a reduction has been detected in multiple sclerosis patients with the main disease phenotypes, with the lowest values seen in secondary progressive multiple sclerosis [26]. Surface expansion of the dentate gyrus of the hippocampus has been described in multiple sclerosis patients (Fig. 3), and in relapsing-remitting multiple sclerosis it has been correlated with better cognitive performance and higher T2 focal lesions, suggesting an inflammation-induced neurogenic (reactive) process of the subgranular zone of the hippocampus aimed at rescuing the functional competence of hippocampal circuitry [27& ].
The dynamic relationship between WM and gray matter damage and their contribution to disease clinical manifestations remain an unsolved issue. A 2-year study, exploring the temporal relationship between WM and gray matter damage, quantified using MTR, in patients with early primary progressive multiple sclerosis showed that over the period of observation, the majority of cortical damage was for a sequela of normal-appearing WM disease, which, in turn, was predicted by abnormalities in WM lesions [28]. Several multiparametric studies consistently support the notion of a complex interplay between damage to the WM and gray matter in determining disease clinical manifestations, including cognitive impairment [29,30].
NEUROPHYSIOLOGICAL MEASURES: PROGNOSIS AND PREDICTIVITY
Evoked potentials, comprising sensory (visual, somatosensory and brainstem auditory) and motor evoked potentials to transcranial magnetic stimulation, assess functionally relevant eloquent pathways, including those not routinely assessed by MRI such as optic nerves and dorso-lumbar spinal cord [31]. Used in combination, they have been reported to well correlate with global measures of disability in relapsing-remitting multiple sclerosis [32,33] and in primary progressive multiple sclerosis [34] and to be predictive of future medium long-term disability [32,35]. For longitudinal monitoring, particularly for clinical trials, the use of quantitative evoked potentials parameters offers an advantage compared with qualitative assessment, with a lower number of patients needed to demonstrate a significant change and better correlation with changes in disability [36&&]. Concerning single modalities, brainstem auditory evoked potentials have the lowest sensitivity at cross-sectional and longitudinal evaluations [32,37], possibly due to the shortest pathway explored, and may be most suitable for the assessment of specific brainstem symptoms. Somatosensory evoked potentials and motor evoked potentials (MEP), particularly to the lower limb, have the advantage of testing the integrity of the corticospinal pathway which is a major determinant of disability, particularly involving locomotion, with the most specific correlation represented by MEPs [38].
Visual evoked potentials (VEP) may detect the involvement of a relevant and frequently affected function, which may be underestimated at standard routine clinical examination. For instance, brain plasticity, reported as a major predictor of highcontrast vision recovery after optic neuritis [39], may compensate for optic nerve damage thus masking the functional consequences of the event. The improvement of VEPs after optic neuritis, occurring over more than 3–5 years [40,41] possibly in relation to remyelination [42,43] or ion channel reorganization [44], as well as slow VEPs latency worsening in the asymptomatic eye, would have been undetected by clinical examination alone but corresponded to changes in contrast sensitivity [41]. Compared with high-contrast, low-contrast visual acuity seems more suitable for monitoring treatment effects [45]. For this reason, the impact of low-contrast stimulation to record VEPs, already suggested in pivotal studies [46], should be better explored. The stability, over more than 3 years, of delayed latency in eyes without past optic neuritis symptoms suggests that VEPs may be useful to test remyelination in clinical trials [40]. This possibility is consistent with the evidence of a good reproducibility of VEPs in multicenter [47] and single center [48], and of the more recent multifocal VEPs (mfVEPs). The latter allow simultaneous but separate assessment of different sectors of central and peripheral visual fields [49], while standard recordings to full-field stimulation (VEPs or ffVEPs) mostly reflect the activity of cortical macular representation. This feature may offer an advantage in detecting and monitoring the involvement of partial optic nerve regions, and to provide more reliable information on retro-chiasmal pathways [50&&]. Compared with standard ffVEPs, mfVEPs have been reported more sensitive both in symptomatic and asymptomatic eyes [49]. In the absence of a previous history of optic neuritis, VEPs sensitivity ranges from 20 to 50% [51,52,53&&,54], which is higher compared with OCT [52,53&&,55–57]. OCT allows us to image retinal neuronal structures such as the ganglion cell layer (GCL) and the retinal nerve fiber layer (RNFL), consisting of amyelinic axons of GCL forming the optic nerve, and to monitor their degeneration following optic nerve damage [58]. In multiple sclerosis, RNFL thickness RNFL thinning follows optic neuritis and correlates with ffVEP latencies [53&&,57,59], whereas in asymptomatic eyes it is associated with delayed latency of ffVEPs [53&&], as well as mfVEP [60,61]. Correlations between thinning of retinal neuronal structures at OCT and brain MRI measures suggest bidirectional transynaptic neurodegeration processes [62,63]. Although VEPs abnormalities correlate well with visual impairment [53&&], little correlation between VEPs and future long-term disability expressed by expanded disability status scale (EDSS) [32,35,64]. Nevertheless, OCT correlates with disability [65] and with spinal cord damage [66], suggesting a better sensitivity of OCT to neuronal damage that occurs independently to slowing of conduction along the visual pathways, which is the main feature influencing ffVEPs. Structural damage as shown by OCT has a prognostic value for future disability [67&&]. However, evidence is missing about any role of OCT in predicting response to DMT. Moreover, its combination with VEPs may be important to disentangle OCT changes related to widespread neurodegenerative processes from those associated with subclinical lesions locally affecting the optic nerve. Although ffVEPs are ideally a better candidate for combination with OCT in monitoring subclinical myelin and axonal damage in multiple sclerosis, due to their lower amplitude variability of mfVEP compared with ffVEP [48] and to a good topographic correspondence with OCT findings [68], larger comparative studies are needed in order to define the best testing algorithm, including neurophysiology, neuroimaging and psychophysical measures, for detecting and monitoring subclinical nervous damage.
Also, the combination of VEPs and MEPs has been shown to provide prognostic information not only at the early stages of multiple sclerosis for medium-term [64,69] and long-term [70] disability, particularly when recorded outside the acute period of a relapse [71& ], but also in primary progressive multiple sclerosis [72]. MEPs correlate with disability also when considered alone [32,73]. Corticospinal delay may be predictive of response to aminopyridine, which improves conduction along demyelinated axons [74]. Corticospinal plasticity, assessed as change in MEPs following pairedassociative stimulation, has been shown to predict clinical recovery of symptoms after a relapse [75&&]. One last mention should involve cognitive potentials, reflecting the extent of cognitive impairment [76] and predicting response to symptomatic treatment such as modafinil for fatigue [77], but deserving further exploration to assess their role in predicting the future evolution of cognitive impairment and the reserve for responsiveness to cognitive rehabilitation.
PREDICTION OF TREATMENT RESPONSE TO DISEASE-MODIFYING AGENTS
If the levels of disease severity and disease activity are playing a role in predicting treatment response, we should find a good role for both MRI and neurophysiological techniques, alone or in combination with clinical markers. There is a major problem in assessing predictive values of treatment response in the absence of a placebo arm because the candidate biomarker may have a prognostic influence or it may really have a predictive value of how the patient will respond to that specific treatment, or it can be a variable combination of both. Moreover, there are other methodological problems analyzed in a recent review from Sormani and De Stefano [78], including the difficulty in defining the treatment response. The evaluation of the predictive value of biomarkers for treatment response can be done just before to start a treatment to orient treatment decisions or in the first period after treatment initiation, usually 6–12 months in order to perceive the early effects of the treatment. Data on the baseline predictivity of MRI in postmarketing studies are very few and based on the post hoc subgroup analysis. As far as we know, there are no data on the predictive value of neurophysiological techniques for treatment response, except our unpublished observation that patients with multiple abnormalities of evoked potentials show a significantly lower response to injectable treatments. In patients with CIS, all the MRI studies failed to reveal a significant predictor of the treatment response [79–82]. There was a trend in all clinical trials performed in CIS for a better response in patients with low T2 lesion load at entry, no other clear signals with predictive value were observed. In a postmarketing study, it has been shown that the presence of gadolinium-enhancing lesions at baseline predicts with an odds ratio 4.7 a poor response to interferon b treatment [83]. A recent meta-analysis of six large randomized clinical trials exploring the efficacy of natalizumab, dymethilfumarate, teriflunomide and fingolimod showed that in relapsing remitting multiple sclerosis (RRMS), higher treatment effects are associated with higher gadolinium activity, lower age and lower disability [84]. Prosperini et al. [85] reported that patients treated with natalizumab with fewer pretreatment relapses or lower EDSS are more likely to be disease free after 2 years of treatment. In another study of a small cohort of patients who started natalizumab treatment, the risk of relapse during treatment was associated with a higher disease activity in the year before starting treatment [86]. In patients who discontinue natalizumab, the early disease reactivation was predicted by the presence of a high clinical or MRI disease activity in the year before the initiation of the natalizumab treatment [87& ,88].
Early identification of patients with a suboptimal response to a DMT would allow a prompt switch to an alternative treatment that could eventually have better efficacy. Several studies have tried to identify clinical and MRI predictors of treatment response to interferons in the initial period of treatment to prevent accumulation of disability [83,89–93]. Interestingly enough, when in a placebo controlled study the presence of disease activity in the first 2 years was examined as a predictor of a long-term disability, a significant effect was observed in interferon b patients and not in the placebo patients, indicating it is the persistence of disease activity despite DMT that determines the predictivity [94]. Rio et al. [95] proposed a scored system based on the combined assessment at 1 year of clinical relapses and disability progression as measured by EDSS. This score has been subsequently validated. A modified Rio score characterized, compared with the old score, by a higher specificity and a lower sensitivity has also been proposed and validated [96–98]. More recently, the Rio score has also been applied to a population of patients treated with Glatiramer Acetate, revealing the same predictivity values [98–100]. Prosperini [101] examined the different thresholds for the definition of treatment failure and found that the presence of one enhancing lesion or two or more new T2 lesions, independently from the clinical activity, was an appropriate compromise between sensitivity and specificity. A very recent study based on a large multicenter clinical dataset collected within MAGNIMS network, including RRMS patients on interferon b treatment with clinical and brain MRI assessment during the first year of treatment and followed for at least 2 years, revealed that the risk of disability progression significantly increased with one relapse and at least three new T2 MRI lesions [102&&]. The 3 years risk of disability progression increased from 17% in patients without relapses and less than three new T2 lesions, to 48% for patients with both conditions. However, it should be noticed that using this threshold, only 6% of patients with disability progression after 3 years of follow-up were classified in the first year of treatment as patients with a bad prognosis. Clearly, this threshold cannot be used to take treatment decisions early during the monitoring of treatment response. There are some evidences that adding brain volume measures to clinical and MRI disease activity measures may increase the value of prediction [103,104]. A meta-analysis aiming at establishing the relevance of MRI markers in predicting a higher risk of treatment failure failed to combine some of the published studies in a quantitative summary estimate, because of the large heterogeneity in both measured markers and outcome assessments [105].
CONCLUSION
Because of the complexity of multiple sclerosis, not only the natural history of the disease displays a large interindividual variability, but also the response to the treatments in RRMS is largely unpredictable. From the theoretical point of view, we can hypothesize that two main factors contribute to this variability: the interindividual variability of disease severity and activity, already discussed in the previous sections; and a variable propensity of a given patient to respond to a specific treatment. Because the available DMTs display multiple and at least partially different mechanisms of action, we could expect to see patients not responding to treatment A to be fully responsive to treatment B. The aim of a DMT for relapsing multiple sclerosis is to reach the condition of no evidence of disease activity, however, about a quarter of patients fail to first treatment in the first 2 years, and the vast majority fails in a long-term observation. Because the possibility to predict the response before starting a treatment is still quite modest, we should concentrate on an early detection of nonresponders to achieve a better control of the disease evolution. From this point of view, there are convincing evidences that conventional MRI and, to a minor extent, a combined use of evoked potentials may provide important information. Major improvements may arise by the use of nonconventional MRI techniques, by further ameliorations of atrophy measures and by more extended and appropriate use of neurophysiological techniques. A general criticism to the published studies is that sensitivity of the biomarker is more important than specificity, particularly in the initial phases of the disease, because the aim of an early monitoring of treatment response is to pick up patients at increased risk of treatment failure. Further, well-performed and methodologically strong multicenter studies need to be performed in the near future to provide the clinician with easy to use and very informative biomarkers.
Acknowledgements
None.
Financial support and sponsorship
None.
Conflicts of interest
L.L. received compensation for consulting services and/or speaking activity from Biogen Idec and Novartis, Excemed, receives research support from the Jacques and Gloria Gossweiler Foundation (Switzerland), Fondazione Italiana Sclerosi Multipla. M.A.R. received speakers honoraria from Biogen Idec, Novartis, Genzyme, Teva Pharmaceutical Industries and receives research support from the Italian Ministry of Health and Fondazione Italiana Sclerosi Multipla. G.C. serves and has served on scientific advisory boards for Teva Pharmaceutical Industries, Novartis, Sanofi, Genzyme, Merck Serono, Excemed, Roche, Almirall, Chugai, Receptos, Forward Pharma; has received compensation for consulting services and/or speaking activities from Teva Pharmaceutical Industries, Novartis, Sanofi, Genzyme, Merck Serono, Biogen Idec, Excemed, Roche, Almirall, Receptos; and receives research support from the Italian Ministry of Health, the Jacques and Gloria Gossweiler Foundation (Switzerland) and ARiSLA (Fondazione Italiana di Ricerca per la SLA).
REFERENCES AND RECOMMENDED READING
Papers of particular interest, published within the annual period of review, have been highlighted as: & of special interest && of outstanding interest
1. && Filippi M, Rocca MA, Ciccarelli O, et al. MRI criteria for the diagnosis of multiple sclerosis: MAGNIMS consensus guidelines. Lancet Neurol 2016; 15:292–303. This review discusses state-of-the-art MRI findings in patients with CISs and proposes modifications to the MRI criteria for the diagnosis of multiple sclerosis to be included in future revisions of the diagnostic criteria
2. && Tintore M, Rovira A, Rio J, et al. Defining high, medium and low impact prognostic factors for developing multiple sclerosis. Brain 2015; 138 ((Pt 7)):1863–1874. This 81-month follow-up study of a well-characterized cohort of 1015 CISs patients evaluated the influence of baseline prognostic factors on the risk for developing clinically definite multiple sclerosis and disability accumulation. Demographic and topographic characteristics were low-impact prognostic factors, the presence of oligoclonal bands was a medium-impact prognostic factor and the number of lesions on brain MRI was a high-impact prognostic factor.
3. Kuhle J, Disanto G, Dobson R, et al. Conversion from clinically isolated syndrome to multiple sclerosis: a large multicentre study. Mult Scler 2015; 8:1013–1024.
4. Ruet A, Arrambide G, Brochet B, et al. Early predictors of multiple sclerosis after a typical clinically isolated syndrome. Mult Scler 2014; 20:1721– 1726.
5. Ruet A, Deloire MS, Ouallet JC, et al. Predictive factors for multiple sclerosis in patients with clinically isolated spinal cord syndrome. Mult Scler 2011; 17:312–318.
6. Kim SS, Richman DP, Johnson WO, et al. Limited utility of current MRI criteria for distinguishing multiple sclerosis from common mimickers: primary and secondary CNS vasculitis, lupus and Sjogren’s syndrome. Mult Scler 2014; 20:57–63.
7. Sombekke MH, Wattjes MP, Balk LJ, et al. Spinal cord lesions in patients with clinically isolated syndrome: a powerful tool in diagnosis and prognosis. Neurology 2013; 80:69–75.
8. Filippi M, Rocca MA, Calabrese M, et al. Intracortical lesions: relevance for new MRI diagnostic criteria for multiple sclerosis. Neurology 2010; 75:1988–1994.
9. Mitjana R, Tintore M, Rocca MA, et al. Diagnostic value of brain chronic black holes on T1-weighted MR images in clinically isolated syndromes. Mult Scler 2014; 20:1471–1477.
10. Wingerchuk DM, Banwell B, Bennett JL, et al. International consensus diagnostic criteria for neuromyelitis optica spectrum disorders. Neurology 2015; 14:177–189.
11. Absinta M, Rocca MA, Colombo B, et al. Patients with migraine do not have MRI-visible cortical lesions. J Neurol 2012; 259:2695–2698.
12. Calabrese M, Oh MS, Favaretto A, et al. No MRI evidence of cortical lesions in neuromyelitis optica. Neurology 2012; 79:1671–1676.
13. Kilsdonk ID, Lopez-Soriano A, Kuijer JP, et al. Morphological features of MS lesions on FLAIR at 7 T and their relation to patient characteristics. J Neurol 2014; 261:1356–1364.
14. Perez-Miralles F, Sastre-Garriga J, Tintore M, et al. Clinical impact of early brain atrophy in clinically isolated syndromes. Mult Scler 2013; 19:1878– 1886.
15. Uher T, Horakova D, Bergsland N, et al. MRI correlates of disability progression in patients with CIS over 48 months. Neuroimage Clin 2014; 6:312– 319.
16. & Rocca MA, Preziosa P, Mesaros S, et al. Clinically isolated syndrome suggestive of multiple sclerosis: dynamic patterns of gray and white matter changes-a 2-year MR imaging study. Radiology 2016; 278:841–853. In this multiparametric study of 37 CIS patients with a clinical and MRI follow-up of 2 years, the authors found a transient volume increase in frontal, parietal, temporal and cerebellar gray matter regions at 3 months in CIS patients, followed with the development of gray matter atrophy.
17. Preziosa P, Rocca MA, Pagani E, et al. Structural MRI correlates of cognitive impairment in patients with multiple sclerosis: a Multicenter Study. Human Brain Mapp 2016; 37:1627–1644.
18. Rocca MA, Valsasina P, Hulst HE, et al. Functional correlates of cognitive dysfunction in multiple sclerosis: a multicenter fMRI Study. Hum Brain Mapp 2014; 35:5799–5814.
19. Longoni G, Rocca MA, Pagani E, et al. Deficits in memory and visuospatial learning correlate with regional hippocampal atrophy in MS. Brain Struct Funct 2015; 220:435–444.
20. Cawley N, Solanky BS, Muhlert N, et al. Reduced gamma-aminobutyric acid concentration is associated with physical disability in progressive multiple sclerosis. Brain 2015; 138:2584–2595.
21. Kearney H, Miszkiel KA, Yiannakas MC, et al. Grey matter involvement by focal cervical spinal cord lesions is associated with progressive multiple sclerosis. Mult Scler 2015. [in press]
22. Kearney H, Schneider T, Yiannakas MC, et al. Spinal cord grey matter abnormalities are associated with secondary progression and physical disability in multiple sclerosis. J Neurol Neurosurg Psychiatry 2015; 86:608– 614.
23. && Schlaeger R, Papinutto N, Panara V, et al. Spinal cord gray matter atrophy correlates with multiple sclerosis disability. Ann Neurol 2014; 76:568– 580. This study of a large group of multiple sclerosis patients demonstrates spinal cord gray matter atrophy in the absence of WM atrophy in relapsing-remitting multiple sclerosis. In progressive multiple sclerosis patients, such a cord gray matter atrophy is more pronounced and contributes to patient disability.
24. Filippi M, Preziosa P, Copetti M, et al. Gray matter damage predicts the accumulation of disability 13 years later. Neurology 2013; 81:1759– 1767.
25. Kearney H, Rocca MA, Valsasina P, et al. Magnetic resonance imaging correlates of physical disability in relapse onset multiple sclerosis of long disease duration. Mult Scler 2014; 20:72–80.
26. Samson RS, Cardoso MJ, Muhlert N, et al. Investigation of outer cortical magnetisation transfer ratio abnormalities in multiple sclerosis clinical subgroups. Mult Scler 2014; 20:1322–1330.
27. & Rocca MA, Longoni G, Pagani E, et al. In vivo evidence of hippocampal dentate gyrus expansion in multiple sclerosis. Hum Brain Mapp 2015; 36:4702–4713. Using MR-based radial mapping, enlargement of the dentate gyrus of the hippocampus was found in patients with multiple sclerosis and was correlated with higher T2 lesion volume and a better cognitive performance.
28. Bodini B, Chard D, Altmann DR, et al. White and gray matter damage in primary progressive MS: the chicken or the egg? Neurology 2016; 86:170– 176.
29. Bisecco A, Rocca MA, Pagani E, et al. Connectivity-based parcellation of the thalamus in multiple sclerosis and its implications for cognitive impairment: a multicenter study. Hum Brain Mapp 2015; 36:2809– 2825.
30. Daams M, Steenwijk MD, Schoonheim MM, et al. Multiparametric structural magnetic resonance imaging in relation to cognitive dysfunction in longstanding multiple sclerosis. Mult Scler 2015. [in press]
31. Leocani L, Comi G. Clinical neurophysiology of multiple sclerosis. Handb Clin Neurol 2014; 122:671–679. 32. Leocani L, Rovaris M, Boneschi FM, et al. Multimodal evoked potentials to assess the evolution of multiple sclerosis: a longitudinal study. J Neurol Neurosurg Psychiatry 2006; 77:1030–1035.
33. Margaritella N, Mendozzi L, Tronci F, et al. The evoked potentials score improves the identification of benign MS without cognitive impairment. Eur J Neurol 2013; 20:1423–1425.
34. Canham LJ, Kane N, Oware A, et al. Multimodal neurophysiological evaluation of primary progressive multiple sclerosis: an increasingly valid biomarker, with limits. Mult Scler Relat Disord 2015; 4:607–613.
35. Kallmann BA, Fackelmann S, Toyka KV, et al. Early abnormalities of evoked potentials and future disability in patients with multiple sclerosis. Mult Scler 2006; 12:58–65.
36. && Schlaeger R, Hardmeier M, D’Souza M, et al. Monitoring multiple sclerosis by multimodal evoked potentials: numerically versus ordinally scaled scoring systems. Clin Neurophysiol 2016; 127:1864–1871. This study demonstrated that the quantitative analysis of evoked potentials allows to find better correlation with clinical disability as compared with qualitative, ordinal classifications. This is relevant not only for future planning of clinical trials, but also for observational studies, including meta-analyses, investigating the value of evoked potentials in monitoring and prognosis of multiple sclerosis.
37. Sater RA, Rostami AM, Galetta S, et al. Serial evoked potential studies and MRI imaging in chronic progressive multiple sclerosis. J Neurol Sci 1999; 171:79–83.
38. Kiylioglu N, Parlaz AU, Akyildiz UO, Tataroglu C. Evoked potentials and disability in multiple sclerosis: a different perspective to a neglected method. Clin Neurol Neurosurg 2015; 133:11–17.
39. Jenkins TM, Toosy AT, Ciccarelli O, et al. Neuroplasticity predicts outcome of optic neuritis independent of tissue damage. Ann Neurol 2010; 67:99– 113.
40. Niklas A, Sebraoui H, Hess E, et al. Outcome measures for trials of remyelinating agents in multiple sclerosis: retrospective longitudinal analysis of visual evoked potential latency. Mult Scler 2009; 15: 68–74.
41. Brusa A, Jones SJ, Plant GT. Long-term remyelination after optic neuritis: a 2-year visual evoked potential and psychophysical serial study. Brain 2001; 124:468–479.
42. Bru¨ck W, Kuhlmann T, Stadelmann C. Remyelination in multiple sclerosis. J Neurol Sci 2003; 206:181–185.
43. Patani R, Balaratnam M, Vora A, Reynolds R. Remyelination can be extensive in multiple sclerosis despite a long disease course. Neuropathol Appl Neurobiol 2007; 33:277–287.
44. Waxman SG. Sodium channels as molecular targets in multiple sclerosis. J Rehabil Res Dev 2002; 39:233–242.
45. Balcer LJ, Galetta SL, Polman CH, et al. Low-contrast acuity measures visual improvement in phase 3 trial of natalizumab in relapsing MS. J Neurol Sci 2012; 318:119–124.
46. Thurtell MJ, Bala E, Yaniglos SS, et al. Evaluation of optic neuropathy in multiple sclerosis using low-contrast visual evoked potentials. Neurology 2009; 73:1849–1857.
47. Brigell M, Kaufman DI, Bobak P, Beydoun A. The pattern visual evoked potential. A multicenter study using standardized techniques. Doc Ophthalmol 1994; 86:65–79.
48. Narayanan D, Cheng H, Tang RA, Frishman LJ. Reproducibility of multifocal visual evoked potential and traditional visual evoked potential in normal and multiple sclerosis eyes. Doc Ophthalmol 2015; 130:31–41.
49. Klistorner A, Fraser C, Garrick R, et al. Correlation between full-field and multifocal VEPs in optic neuritis. Doc Ophthalmol 2008; 116: 19–27.
50. && Alshowaeir D, Yiannikas C, Garrick R, et al. Latency of multifocal visual evoked potentials in nonoptic neuritis eyes of multiple sclerosis patients associated with optic radiation lesions. Invest Ophthalmol Vis Sci 2014; 55:3758–3764. This study, performed on 57 patients with no history of optic neuritis, demonstrated a correlation between the presence of retrochiasmal lesions and the latency of mfVEPs, thus opening the use of an electrophysiological technique for exploring this portion of the visual pathway which is generally difficult to assess using VEPs from full-field stimulation.
51. Sisto D, Trojano M, Vetrugno M, et al. Subclinical visual involvement in multiple sclerosis: a study by MRI, VEPs, frequency-doubling perimetry, standard perimetry, and contrast sensitivity. Invest Ophthalmol Vis Sci 2005; 46:1264–1268.
52. Naismith RT, Tutlam NT, Xu J, et al. Optical coherence tomography is less sensitive than visual evoked potentials in optic neuritis. Neurology 2009; 73:46–52.
53. && Di Maggio G, Santangelo R, Guerrieri S, et al. Optical coherence tomography and visual evoked potentials: which is more sensitive in multiple sclerosis? Mult Scler 2014; 20:1342–1347. This study reported the superiority of standard full-field VEPs in detecting subclinical lesions in the visual pathways, as compared with high-resolution spectraldomain OCT, consistently with other previous studies using lower resolution timedomain OCT techniques.
54. Voitenkov V, Skripchenko N, Klimkin A. Visual pathways involvement in clinically isolated syndrome in children. Int J Ophtalmol 2015; 8:382–384.
55. Thurtell MJ, Galetta SJ. Low-contrast multifocal visual evoked potentials: identifying more shades of gray in MS. Neurology 2012; 79:732–733.
56. Herrero R, Garcia-Martin E, Almarcegui C, et al. Progressive degeneration of the retinal nerve fiber layer in patients with multiple sclerosis. Invest Ophthalmol Vis Sci 2012; 53:8344–8349.
57. Chilin´ ska A, Ejma M, Turno-Kre˛cicka A, et al. Analysis of retinal nerve fibre layer, visual evoked potentials and relative afferent pupillary defect in multiple sclerosis patients. Clin Neurophysiol 2016; 127:821–826.
58. Costello F. Evaluating the use of optical coherence tomography in optic neuritis. Mult Scler Int 2011; 2011:148394.
59. Tugcu B, Soysal A, Kilic M, et al. Assessment of structural and functional visual outcomes in relapsing remitting multiple sclerosis with visual evoked potentials and optical coherence tomography. J Neurol Sci 2013; 335:182– 185.
60. Klistorner A, Garrick R, Barnett MH, et al. Axonal loss in nonoptic neuritis eyes of patients with multiple sclerosis linked to delayed visual evoked potential. Neurology 2013; 80:242–245.
61. Sriram P, Wang C, Yiannikas C, et al. Relationship between optical coherence tomography and electrophysiology of the visual pathway in nonoptic neuritis eyes of multiple sclerosis patients. PLoS One 2014; 9:e102546.
62. Gabilondo I, Martı´nez-Lapiscina EH, Martı´nez-Heras E, et al. Trans-synaptic axonal degeneration in the visual pathway in multiple sclerosis. Ann Neurol 2014; 75:98–107.
63. Balk LJ, Steenwijk MD, Tewarie P, et al. Bidirectional trans-synaptic axonal degeneration in the visual pathway in multiple sclerosis. J Neurol Neurosurg Psychiatry 2015; 86:419–424.
64. Fuhr P, Borggrefe-Chappuis A, Schindler C, Kappos L. Visual and motor evoked potentials in the course of multiple sclerosis. Brain 2001; 124:2162–2168.
65. Ratchford JN, Saidha S, Sotirchos ES, et al. Active MS is associated with accelerated retinal ganglion cell/inner plexiform layer thinning. Neurology 2013; 80:47–54.
66. Oh J, Sotirchos ES, Saidha S, et al. Relationships between quantitative spinal cord MRI and retinal layers in multiple sclerosis. Neurology 2015; 84:720– 728.
67. && Martinez-Lapiscina EH, Arnow S, Wilson J, et al. Retinal thickness measured by optical coherence tomography and risk of disability worsening in multiple sclerosis. The Lancet Neurology 2016. (in press). This large, multicenter study provides evidence that evidence of retinal neuroaxonal damage as assessed by OCT is predictive of a worse disability after 2 years, measured with EDSS.
68. Klistorner A, Arvind H, Nguyen T, et al. Multifocal VEP and OCT in optic neuritis: a topographical study of the structure-function relationship. Doc Ophthalmol 2009; 118:129–137.
69. Schlaeger R, D’Souza M, Schindler C, et al. Combined evoked potentials as markers and predictors of disability in early multiple sclerosis. Clin Neurophysiol 2012; 123:406–410.
70. Schlaeger R, Schindler C, Grize L, et al. Combined visual and motor evoked potentials predict multiple sclerosis disability after 20 years. Mult Scler 2014a; 20:1348–1354.
71. & Schlaeger R, D’Souza M, Schindler C, et al. Prediction of MS disability by multimodal evoked potentials: investigation during relapse or in the relapsefree interval? Clin Neurophysiol 2014; 125:1889–1892. This study provided evidence that multimodal EPs performed during the relapse have a lower predictive value on future disability compared with EPs in the relapsing-free interval, the latter better reflecting the residual functional involvement of eloquent pathways rather than a potentially transient conduction impairment, as that observed during a relapse.
72. Schlaeger R, D’Souza M, Schindler C, et al. Electrophysiological markers and predictors of the disease course in primary progressive multiple sclerosis. Mult Scler 2014c; 20:51–56.
73. Kale N, Agaoglu J, Onder G, Tanik O. Correlation between disability and transcranial magnetic stimulation abnormalities in patients with multiple sclerosis. J Clin Neurosci 2009; 16:1439–1442.
74. Zeller D, Reiners K, Bra¨uninger S, Buttmann M. Central motor conduction time may predict response to fampridine in patients with multiple sclerosis. J Neurol Neurosurg Psychiatry 2014; 85:707–709.
75. && Mori F, Kusayanagi H, Nicoletti CG, et al. Cortical plasticity predicts recovery from relapse in multiple sclerosis. Mult Scler 2014; 20:451– 457. This study reported, in 22 patients newly diagnosed with multiple sclerosis, that mechanism of long-term potentiation-like plasticity, tested using paired-associative stimulation, predicts the clinical recovery after a relapse.
76. Sundgren M, Wahlin A˚ , Maurex L, Brismar T. Event related potential and response time give evidence for a physiological reserve in cognitive functioning in relapsing-remitting multiple sclerosis. J Neurol Sci 2015; 356:107– 112.
77. Nagels G, D’hooghe MB, Vleugels L, et al. P300 and treatment effect of modafinil on fatigue in multiple sclerosis. J Clin Neurosci 2007; 14:33– 40.
78. Sormani MP, De Stefano N. Defining and scoring response to IFN-b in multiple sclerosis. Nat Rev Neurol 2013; 9:504–512.
79. Moraal B, Pohl C, Uitdehaag BMJ, et al. Magnetic resonance imaging predictors of conversion to multiple sclerosis in the BENEFIT study. Arch Neurol 2009; 66:1345–1351.
80. Comi G, Martinelli V, Rodegher M, et al. Effect of glatiramer acetate on conversion to clinically definite multiple sclerosis in patients with clinically isolated syndrome (PreCISe study): a randomised, double-blind, placebocontrolled trial. Lancet 2009; 374:1503–1511.
81. Kappos L, Polman CH, Freedman MS, et al. Treatment with interferon beta-1b delays conversion to clinically definite and McDonalds MS in patients with clinically isolated syndromes. Neurology 2006; 67:1242– 1249.
82. Comi G, Filippi M, Barkhof F, et al. Effect of early interferon treatment on conversion to definite multiple sclerosis: a randomized study. Lancet 2001; 357:1576–1582.
83. Tomassini V, Paolillo A, Russo P, et al. Predictors of long-term clinical response to interferon beta therapy in relapsing mulitiple sclerosis. J Neurol 2006; 253:287–293.
84. Signori A, Schiavetti I, Gallo F, Sormani MP. Subgroups of multiple sclerosis patients with larger treatment benefits: a meta-analysis of randomized trials. Eur J Neurol 2015; 22:960–966.
85. Prosperini L, Gianni C, Barletta V, et al. Predictors of freedom from disease activity in natalizumab treated-patients with multiple sclerosis. J Neurol Sci 2012; 323:104–112.
86. Laroni A, Gandoglia I, Solaro C, et al. Clinical baseline factors predict response to natalizumab; their usefulness in patient selection. BMC Neurology 2014; 14:103.
87. & Sangalli F, Moiola L, Ferre` L, et al. Long-term management of natalizumab discontinuation in a large monocentric cohort of multiple sclerosis patients. Mult Scler Relat Disord 2014; 3:520–526. This is the first article to indicate that patients with high disease activity before starting natalizumab are at a high risk of early reactivation after natalizumab discontinuation
88. Vidal-Jordana A, Tintore´ M, Tur C, et al. Significant clinical worsening after natalizumab withdrawal: predictive factors. Mult Scler 2015; 21:780– 785.
89. Rudick R, Lee J, Simon J, et al. Defining interferon b response status in multiple sclerosis patients. Ann Neurol 2004; 56:548–555.
90. Durelli L, Barbero P, Bergui M, et al. MRI activity and neutralising antibody as predictors of response to interferon ß treatment in multiple sclerosis. J Neurol Neurosurg Psychiatry 2008; 79:646–651.
91. Rio J, Rovira A, Tintore´ M, et al. Relationship between MRI lesion activity and response to IFN-beta in relapsing remitting multiple sclerosis patients. Mult Scler 2008; 14:479–484.
92. Rio J, Comabella M, Montalban X. Predicting responders to therapies for multiple sclerosis. Nat Rev Neurol 2009; 5:553–560. 93. Prosperini L, Gallo V, Petsas N, et al. One-year MRI scan predicts clinical response to interferon beta in multiple sclerosis. Eur J Neurol 2009; 16:1202–1209.
94. Bermel R, You X, Foulds P, et al. Predictors of long-term outcome in multiple sclerosis patients treated with interferon beta. Ann Neurol 2013; 73:95– 103.
95. Rio J, Castillo J, Rovira A, et al. Measures in the first year of therapy predict the response to interferon ß in MS. Mult Scler 2009; 15:848– 853.
96. Sormani M.P, Rio J, Tintore` M, et al. Scoring treatment resonse in patients with relapsing multiple sclerosis. Mult Scler 2012; 19:605– 612.
97. Sormani M, et al. Refining response to treatment as defined by the Modified Rio Score. Mult Scler 2013; 19:1246–1247.
98. Romeo M, Martinelli V, Rodegher M, et al. Validation of 1-year predictive score of long-term response to interferon in everyday clinical practice multiple sclerosis patients. Eur J Neurol 2015; 22:973–980.
99. Rio J, Rovira A, Tintore´ M, et al. Evaluating the response to glatiramer acetate in relapsing-remitting multiple sclerosis (RRMS) patients. Mult Scler 2014; 20:1602–1608.
100. Romeo M, Martinelli-Boneschi F, Rodegher M, et al. Clinical and MRI predictors of response to interferon-beta and glatiramer acetate in relapsing-remitting multiple sclerosis patients. Eur J Neurol 2013; 20:1060– 1067.
101. Prosperini L, Mancinelli CR, De Giglio L, et al. Interferon beta failure predicted by EMA criteria or isolated MRI activity in multiple sclerosis. Mult Scler 2014; 20:566–576.
102. && Sormani MP, Gasperini C, Romeo M, et al. Assessing response to interferonbeta in a large multicentre dataset of multiple sclerosis patients. Neurology 2016. [in press] It is the largest study evaluating the predictable value of combined clinical and MRI activity.
103. Rojas JL, Patrucco L, Miguez J, et al. Brain atrophy as a nonresponse predictor to interferon-beta in relapsing-remitting multiple sclerosis. Neurol Res 2014; 36:615–618.
104. Pe´rez-Miralles FC, Sastre-Garriga J, Vidal-Jordana A, et al. Predictive value of early brain atrophy on response in patients treated with interferon beta. Neruol Neuroimmnol Neuroinflamm 2015; 2:e132.
105. Dobson R, Rudick RA, Turner B, et al. Assessing treatment response to interferon-ß. Is there a role for MRI? Neurology 2014; 82:248–254.